System-Level Power Profiling for AI Workloads at ESAIL

Machine-learning workloads rely heavily on GPU computation and exhibit high energy consumption. With the rapid growth of both training and large-scale inference deployments, energy efficiency has become a key research concern alongside performance. This is especially important for deployments on embedded devices, where limited compute resources must operate within strict energy budgets. Optimizing machine-learning algorithms with respect to their energy consumption is therefore a central focus of ongoing research at the Energy-Efficient Systems and AI Lab (ESAIL).
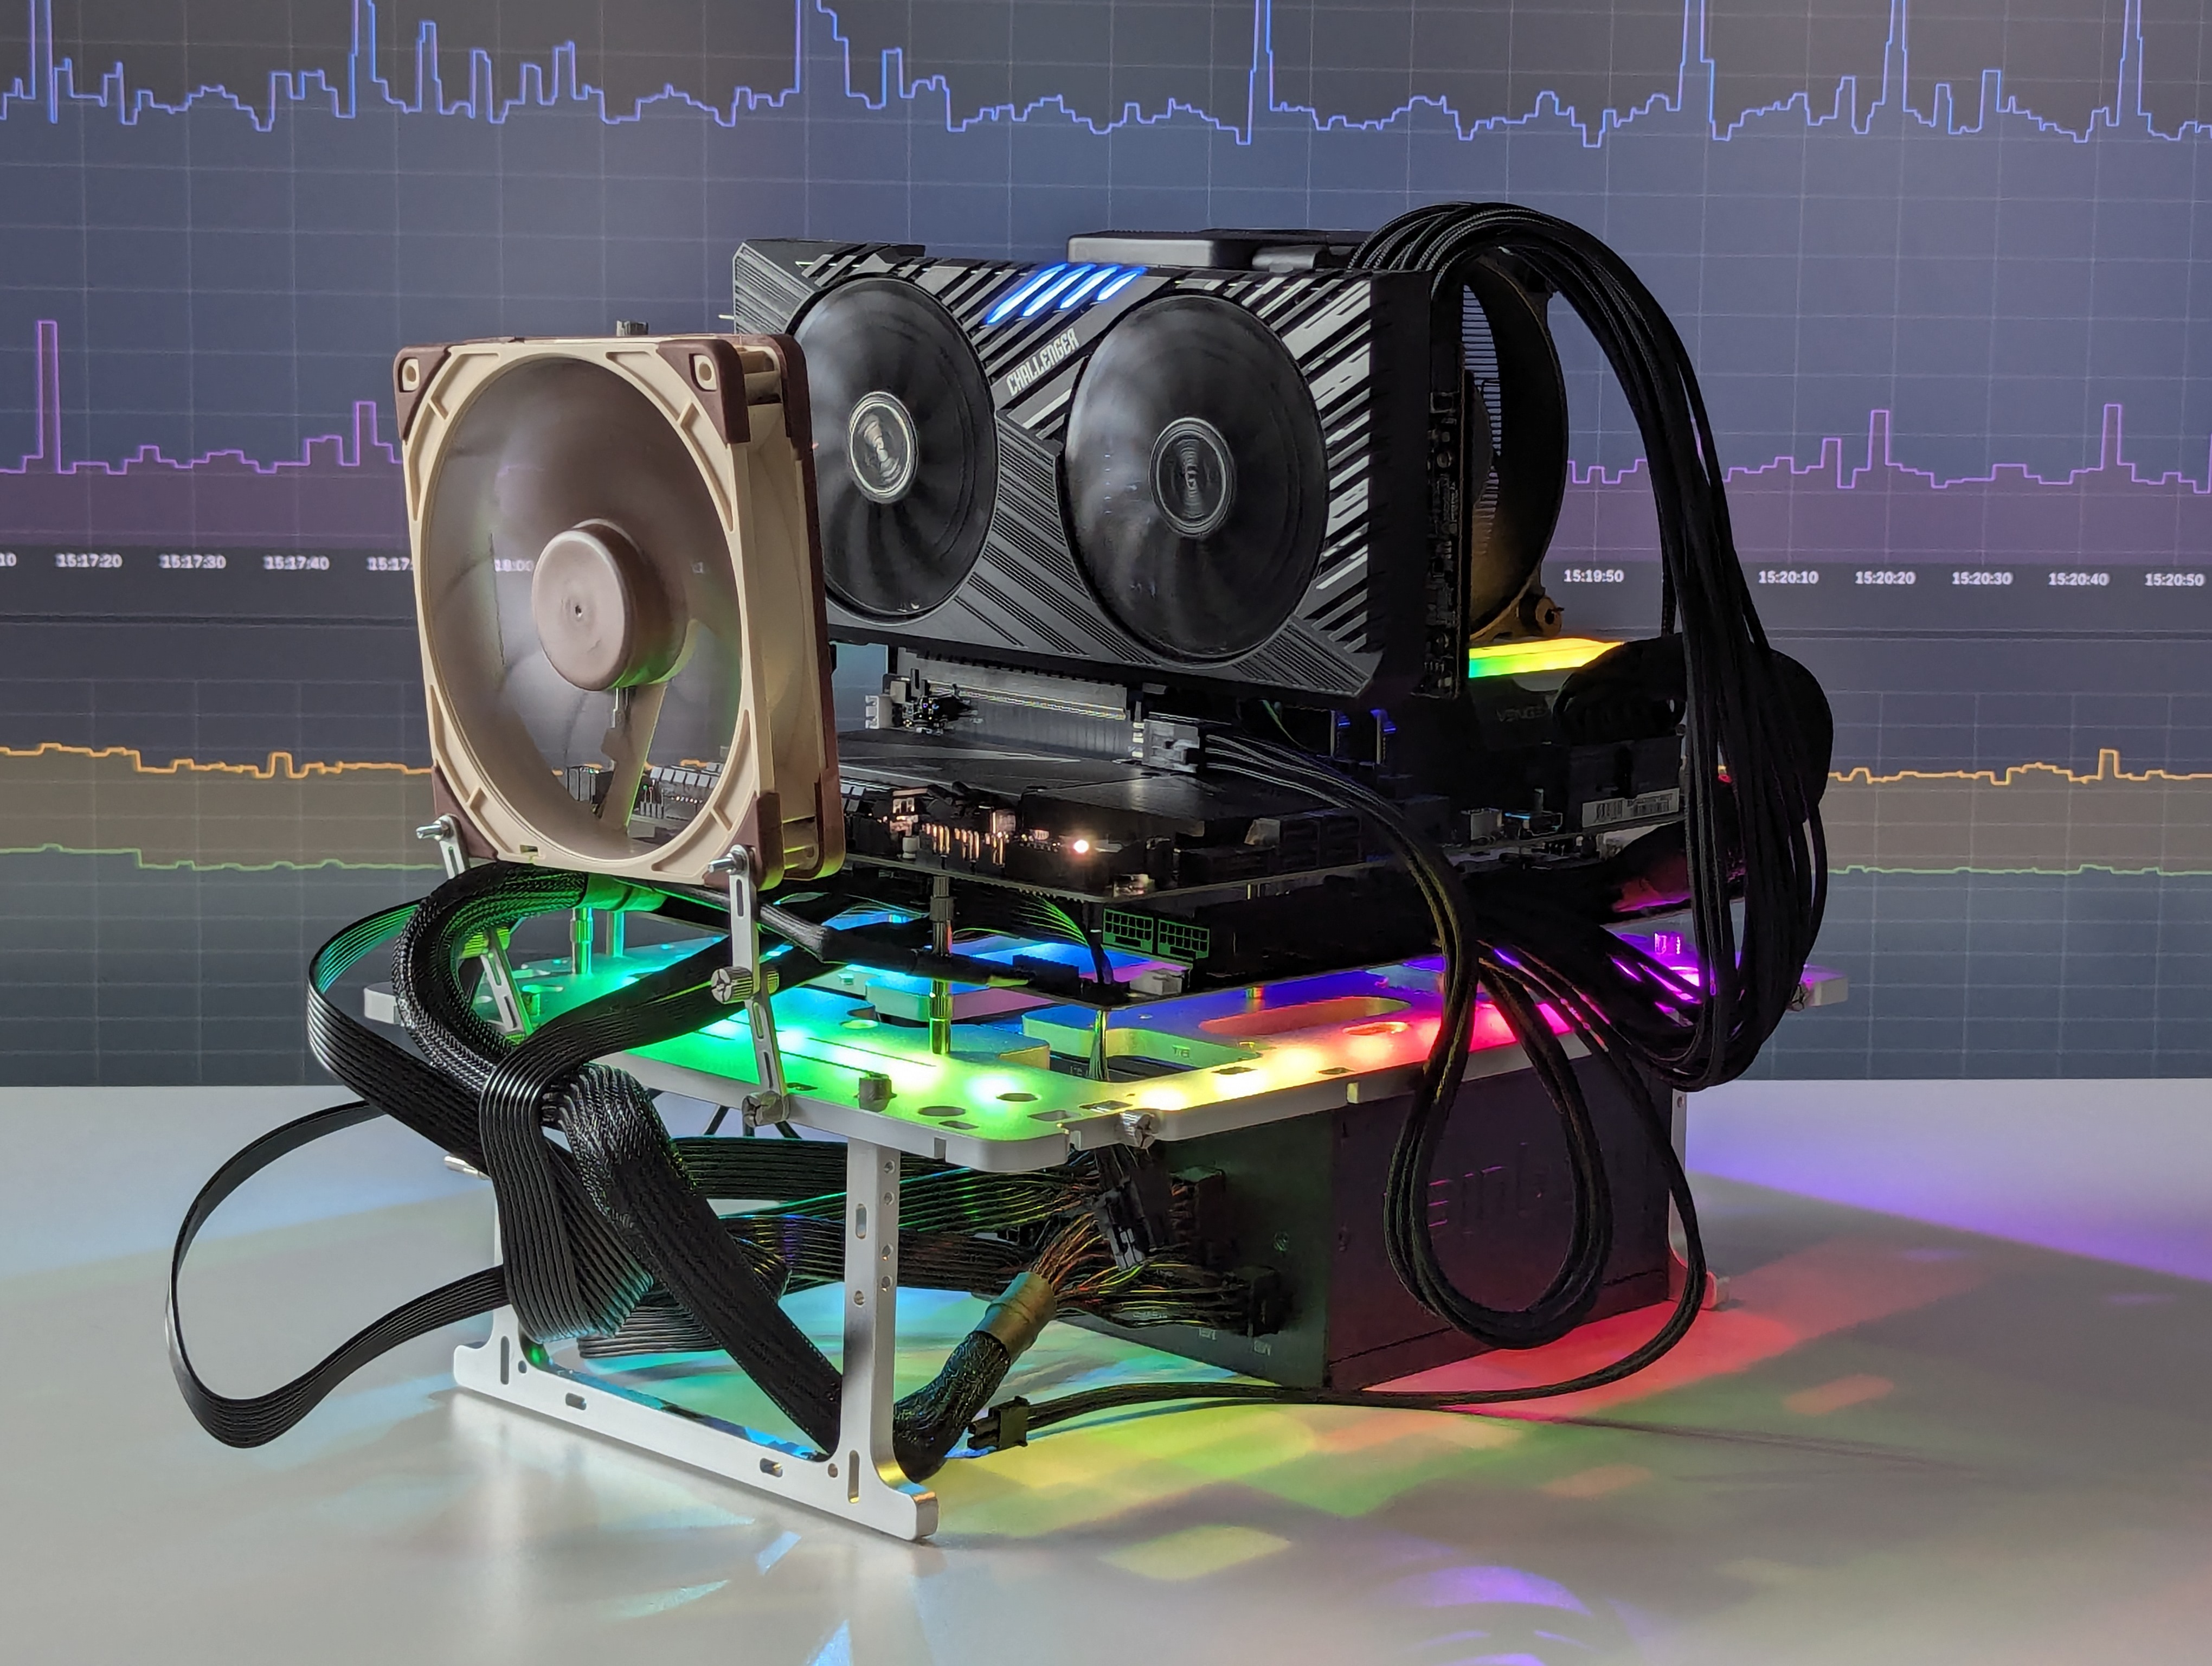
Evaluating energy-aware optimizations requires accurate and reproducible power measurements under realistic workload conditions. To this end, ESAIL employs a new profiling system, designed to capture detailed system-level power and energy metrics during real workload execution.
Why System-Level Power Profiling?
Most modern CPUs and GPUs expose onboard power telemetry, but these sensors are fundamentally limited in scope. They report only the power consumed by the chip itself, not the energy required to operate the entire system. In modern PC systems, system memory (RAM) and GPU-attached memory (VRAM) often represent major power consumers after the primary compute devices, particularly under data-intensive workloads.
For machine-learning workloads, this distinction is critical, as such workloads are characterized by high memory bandwidth requirements and frequent data movement between memory and compute units. In addition, large models and datasets often require substantial memory capacity, typically provided by multiple RAM modules and large VRAM configurations, which increases baseline energy demand. Furthermore, both training and large-scale inference workloads frequently execute over extended periods of time. As a result, even relatively small and unmeasured power contributions, such as those originating from memory subsystems, can accumulate and significantly distort total energy estimates.
Additional components, such as the motherboard, chipset, and power-delivery infrastructure (e.g., VRMs), as well as peripheral devices including USB and LAN controllers, also contribute to overall system power consumption. These contributions are largely workload-independent and therefore not the primary focus of AI energy optimization; however, they contribute to the total system energy budget and become relevant when reporting absolute energy consumption or comparing across different system configurations.
The goal of the profiling system used at ESAIL is to address the limitations of vendor-provided power sensors by enabling direct measurement of system-level power consumption while still allowing attribution to individual subsystems (e.g., CPU, GPU, and motherboard). This makes it possible to evaluate optimizations in terms of actual energy cost, rather than approximations derived from partial telemetry.
Profiling Setup Based on BENCHLAB

To enable system-level power measurements, the profiling system employs BENCHLAB as an external telemetry layer between the power supply unit (PSU) and the system under test (SUT). BENCHLAB is a dedicated measurement PCB, the size of an ATX motherboard, that intercepts all primary power rails supplying the system.
The board performs direct electrical measurements on the power rails and supports all standard PC power connectors, including the 24-pin ATX (motherboard), 4+4-pin EPS (CPU), PCIe auxiliary power, and 12VHPWR (GPU) interfaces. To fully capture GPU power consumption, an additional PCIe slot power measurement adapter is placed between the motherboard’s PCIe slot and the GPU. This enables measurement of slot-delivered power, which is combined in software with the power delivered by the auxiliary connectors to obtain the total GPU power draw.
While BENCHLAB also exposes additional features such as temperature sensing, fan-speed monitoring, and RGB control, the profiling system used in this work exclusively utilizes its electrical power measurement capabilities to obtain accurate and reproducible power data.
Measurement data from BENCHLAB is streamed to the host system via USB and acquired using a Python-based data acquisition pipeline built on pyserial. Raw sensor readings are decoded and aggregated in software and logged in CSV format, enabling seamless integration into Python-based machine-learning scripts and post-processing workflows. Power measurements are sampled at a frequency exceeding 400 Hz, with a nominal measurement accuracy of approximately 3 %. This allows power and energy metrics to be correlated directly with specific phases of model execution, such as training and inference. Alternatively, a Grafana-based live dashboard provides real-time visualization of system-level power consumption.
In summary, the profiling system enables system-level power measurements with explicit attribution to major subsystems. In the current setup, power consumption is measured separately for the CPU, the GPU, and the motherboard, providing a comprehensive view of overall system energy usage during workload execution.
Current System under test (SUT)
- CPU: AMD Ryzen 9 9950X3D
- GPU: AMD Radeon RX 7900 GRE
- RAM: VENGEANCE (2 x 48 GB) DDR5 6000 MT/s
- SSD: Samsung SSD 9100 PRO 2TB
- Motherboard: Gigabyte X870 AORUS ELITE WIFI7
- Measurement hardware: BENCHLAB
- OS: Ubuntu
- GPU software stack: ROCm

Early Results

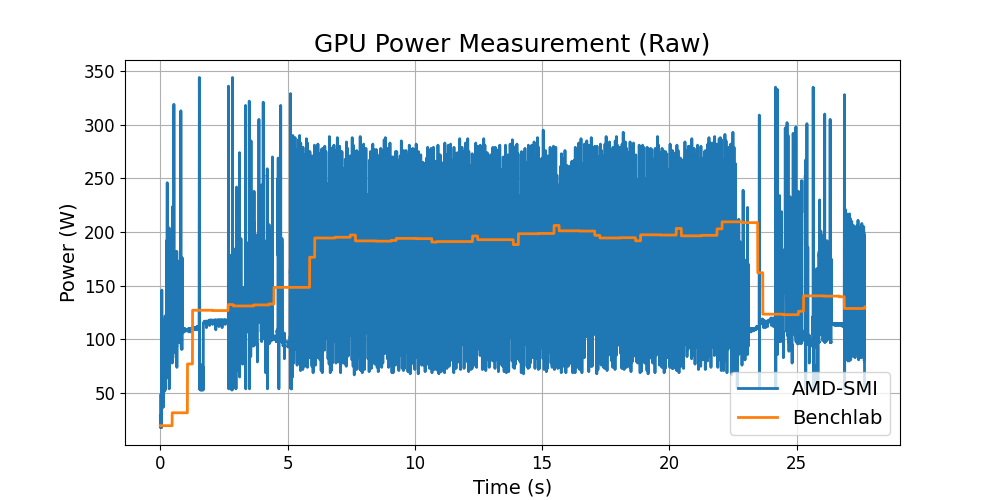
Figure 4 shows the raw GPU power measurements obtained from the vendor-provided sensor via amd-smi (blue) and from the external BENCHLAB measurement (orange) during training of ShuffleNetV2 for one epoch. The power trace reported by the vendor sensor exhibits pronounced temporal variability with frequent short-lived upward and downward excursions, resulting in a visually noisy power trace. In contrast, the power trace measured by BENCHLAB appears comparatively smooth.
This difference in signal characteristics suggests that the two measurement approaches capture different aspects of GPU power consumption. The highly dynamic behavior observed in the vendor-reported data is consistent with workloads involving frequent kernel launches and terminations, which lead to rapid changes in chip-level activity. By comparison, BENCHLAB measures the total GPU board power, including the effects of voltage-regulation modules (VRMs) and onboard capacitance. These components can buffer short-term power fluctuations, leading to a smoother signal at the board level. As a result, BENCHLAB does not resolve fine-grained intra-chip power dynamics but instead reflects the aggregated power demand of the GPU board.

Figure 5 shows the same measurements after applying a moving average filter with a window size of 200 samples. After smoothing, a systematic offset between the two signals becomes apparent: the power reported by amd-smi is approximately 20 W lower than the power measured by BENCHLAB. In addition, a temporal offset of roughly one second can be observed between the vendor sensor data and the BENCHLAB measurements.
This temporal delay is likely attributed to the data acquisition pipeline and software-level latencies. However, the systematic power offset confirms that the vendor-reported power values underestimate the actual GPU board power under the examined workload. While amd-smi tracks chip-level activity, BENCHLAB captures the total board-level power draw, including the efficiency losses from voltage regulation and the buffering effects of onboard capacitance.
Taken together, these observations indicate that chip-level telemetry and external board-level measurements are not directly interchangeable and may lead to substantially different energy estimates when integrated over time. For this experiment using ShuffleNetV2, the resulting difference in total energy consumption amounts to 11.7 %. Depending on workload characteristics and execution duration, this discrepancy may be higher or lower. For example, in the case of VGG19, which places significantly higher demands on memory, the corresponding difference was 15.9 % on average.
Summary
The comparison between vendor-reported GPU power telemetry and external board-level measurements highlights systematic differences in both signal dynamics and absolute power levels. While on-chip telemetry reflects rapid changes in GPU activity, external measurements capture the aggregated power demand after the buffering effects introduced by the power-delivery infrastructure.
Ultimately, the choice of measurement methodology significantly impacts the interpretation of energy efficiency. While vendor telemetry sensors help to shape our understanding of power dynamics across numerous short-lived kernel launches, external board-level measurements are essential for determining the true energy cost of long-lived workloads. For workload execution central to modern AI research, these discrepancies accumulate into a substantial margin of error. The profiling system used at ESAIL provides the necessary ground truth to ensure that energy-aware optimizations are evaluated against their actual physical footprint.

 Google Scholar
